What to do with a Lost Cause
In the lead up to almost any election, you can find some people who’ll always believe that their candidate has a chance to win, even if he or she is substantially behind in the polls. The lure of the comeback — and the history of actual comebacks — is powerful enough to make otherwise smart individuals blind to reality.
In these instances, this search for a glimmer of positive news can often lead to data fool’s gold. With the plethora of publicly available surveys these days, combined with rumors about hopeful Internal tracking numbers leaked from campaigns, it’s possible for anyone to find the data point they need to justify their enthusiasm.
Now, this afflicted some supporters of the Clinton campaign in days prior to the New Hampshire primary. They’re on record as thinking that, while perhaps not winning, that they had a legitimate shot at closing the gap on Bernie Sanders. Weeks beforehand, even Nate Silver on fivethirtyeight.com had Clinton as having a better than 50 percent chance of winning in mid-January.
We have no doubt that a single-digit loss to Sanders could have shifted the narrative in Clinton’s favor, but wanting it to happen is not the same as it being likely to happen. Based on the data that we’ve been gathering at Trendency Research over the past several months, however, even the most optimistic of Clinton supporters should have averted their attention away from New Hampshire and onto Nevada and South Carolina.
Trendency Research is an online survey platform that attempts to the break the mold of traditional polling. In our surveys, we don’t ask for binary responses to questions. Instead, we allow users to allocate their choice of candidate on a sliding scale. They can apportion all their support to one person, or divide it among several if they haven’t made up their mind. Voters who log in to take our surveys online do so on a regular basis over the course of several months and the site registers the changes (or lack thereof) in their opinions on each visit.
In the analysis, Trendency algorithms utilize Threshold Analysis to separate strong supporters from weak. Voters at higher Thresholds are more likely to cast a ballot for that candidate and less likely to switch their allegiance. As you move to lower Thresholds, voters begin to divide their support among more candidates who they may or may not end up voting for.
In the end, this allows for a more nuanced view of the horserace than simply topline results. For instance, a voter logging into Trendency may give Sanders 100-percent support one month and then only 75-percent support the next. Under the conditions of a standard survey, this voter would still say they were voting for Bernie, even though the strength of their support has dipped. Trendency reads this movement and inputs it into the Threshold Analysis.
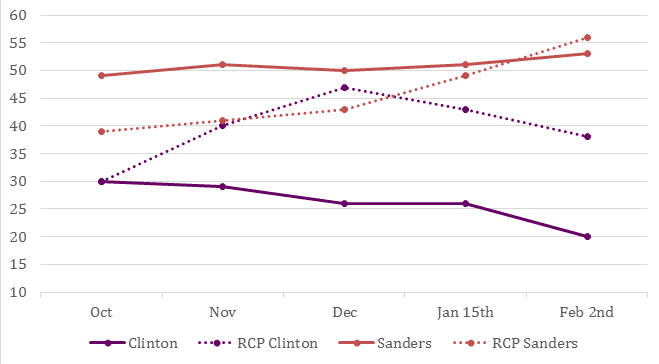
In New Hampshire, we conducted research from October through the primary and the strength of support for Sanders never wavered. Back at the beginning of our research, Sanders held a 49 to 30 percent lead over Clinton in the average Threshold analysis (this number is not quite the same as the horse race, but can be thought of as similar). At the time, among stronger supporters at the 90 and 75 Thresholds, Sanders led Clinton with 75 percent and 67 percent of the vote respectively. From Day One, Sanders enjoyed a loyal and passionate following among New Hampshire voters, something Clinton could never overcome.
Right before the primary, right when some Clinton supporters hoped she might have another New Hampshire comeback in her, Trendency data showed otherwise. In fact, our numbers had Sanders increasing his advantage right before the vote. At the time, he garnered an astonishing 82 percent support at the 90 Threshold and 76 percent at the 75 Threshold.

The graph above shows both the Trendency average Threshold analysis and the average from Real Clear Politics. As you can see, Trendency maintained a large enthusiasm gap between Sanders and Clinton from the beginning. While the public polling average showed Clinton in the lead until early January and then heading south, Trendency showed that Sanders enjoyed a close to 20-point margin back in October on the Average Threshold.
In the end, the official Clinton camp was smart not to raise expectations in New Hampshire, as some in her organization surely saw the writing on the wall. Her visit to Flint, Mich. two days before the primary is a testament to that.
But Trendency Research data shows those Clinton supporters who did harbor hope for a comeback were misplaced in their beliefs. New Hampshire was never going to tilt in her direction, as there were simply too many passionate Sanders supporters in the state who were never going to consider switching their allegiance. Anyone who was shocked about the extent of the Sanders win was just looking at the wrong data.
Stefan Hankin is founder and president of Lincoln Park Strategies, a Washington D.C.-based public opinion firm. Follow him on Twitter at @LPStrategies.
