Why the Michigan Polling Miss Is a Larger Problem for the Industry
Heading into the Democratic Primary in Michigan, the Real Clear Politics polling average had Hillary Clinton leading Bernie Sanders by 21 points (59-to-37 percent) and not a single public poll had Clinton leading by less than double digits since September.
Based on these numbers, polling analyst Nate Silver gave Clinton a 99-percent chance of winning. With Sanders winning Michigan by 1.5 points, there are plenty of questions. Was there a last-minute surge of Sanders supporters who turned this into an upset, or did the pollsters miss something?
It’s unlikely that Sanders’ unexpected victory was due to a last-minute surge of voters who made up their mind, or changed it, after they took a survey. According to CNN’s exit polls, 21 percent of voters decided who they were going to vote for in the last week, and 78 percent decided earlier than that. While that 21 percent could certainly explain a Sanders surge, he only won 50 percent of those voters who decided in the last week while Clinton took 47 percent.
Clearly a good portion of Michigan’s Democratic primary voters were still up for grabs during the last debate, but neither candidate was able to sway enough of them to have a strong impact on the results. Therefore something must have been off in the polling or sampling.
A poll is only good if you’re polling the right people, which sounds simple enough. But in states like Michigan, where there’s no party registration, the presidential race has an open primary. In 2008, President Obama wasn’t even on the ballot because of a fight between Michigan and the Democratic National Committee. With all of these factors finding the right people is very difficult.
We should cut the pollsters some slack. Still, we shouldn’t just call it a day and hope we get it right in fours years from now. It’s always good to go back and see where the polls went wrong. To try to figure out what went wrong we looked through the different demographic breaks based on the exit polls to see what had the most significant effect on the skewed poll results.
While there were many polls in Michigan, most didn’t provide the full crosstabs of data that we need in order to get a full picture of who they talked to and where they could have gone wrong. Luckily, both CBS News’ Tracking poll and PPP’s February poll provide detailed crosstabs so we’re using these polls for the majority of our analysis: most other pollsters probably ran into the same issues.
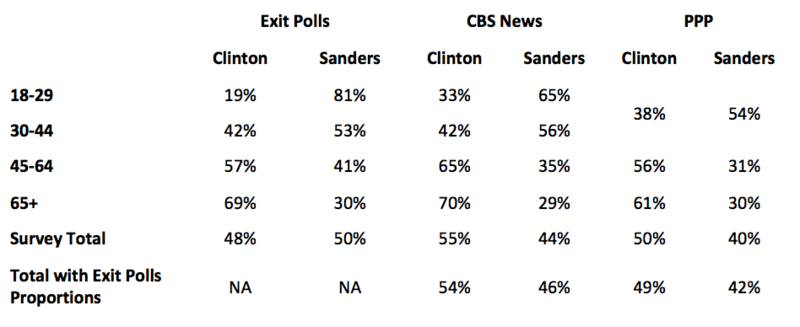
As with many other analyses of the Michigan polls today, we also see that the proportion of younger voters is much lower in the polls than it was in the actual turnout. As you can see below, CBS News was three points too low in voters under 30, while PPP was 6 points too low among voters under 45. Both polls over compensated for middle-age voters (those 45-64).

Although many are pointing to not taking into account young voters as a key reason why the polling was so off, it was actually not a big factor. Let’s say that CBS and PPP had correctly predicted the turnout by age. Adjusting the results means that Clinton would have lead Sanders by 8 points in the CBS poll (54-to-46 percent) and she would also lead in the PPP poll by 7 points (49-to-42 percent). While that closes the gap, just changing the age makeup of the electorate doesn’t explain her loss.

Moreover, if we take the proportions of each age group that CBS had predicted would turn out and then substitute the results for each age group according to the exit polls, CBS would have had Clinton and Sanders tied at 49 percent. Therefore it’s not about undersampling young people; it’s about who these pollsters were talking to. So if not age, what was the problem? The one group that seems to be the issue: Independent voters.
As you can see below, CBS News was 14 points too low among voters who identified as Independents. But the vote by party ID in the CBS News poll is similar to the vote reported in the exit polls. In fact, CBS News had Clinton just two points higher among both Democrats and Independents than the exit polls showed. Therefore, when you allocate the CBS News poll vote using the Democrat/Independent ratio the exit poll found, Sanders would have only been trailing by two points, well within the margin of error.

This doesn’t explain every wrong poll from Michigan. PPP was off on the party ID overall and had internals among this cohort that were way off, too. CBS News missed the overall party identification, but nailed the internals.
While we knew Michigan would be tough to figure out, the missed polling points to a larger problem that’s happening in the industry. Once a poll or two comes out with a consistent view of the likely electorate that predicted electorate often times sticks until the election.
Very rarely does anyone come out and say, what happens if there’s a higher portion of Independents on Election Day? Pollsters too often take the safe route and would rather be wrong with the crowd than stick their neck out on line and say, “we have a different view on turnout.”
The consistency of the incorrect electorates in the Michigan polls demonstrates that there’s a problem with groupthink in the industry, not that polls should be discounted all together.
Stefan Hankin is founder and president of Lincoln Park Strategies, a Washington D.C.-based public opinion firm. Follow him on Twitter at @LPStrategies.